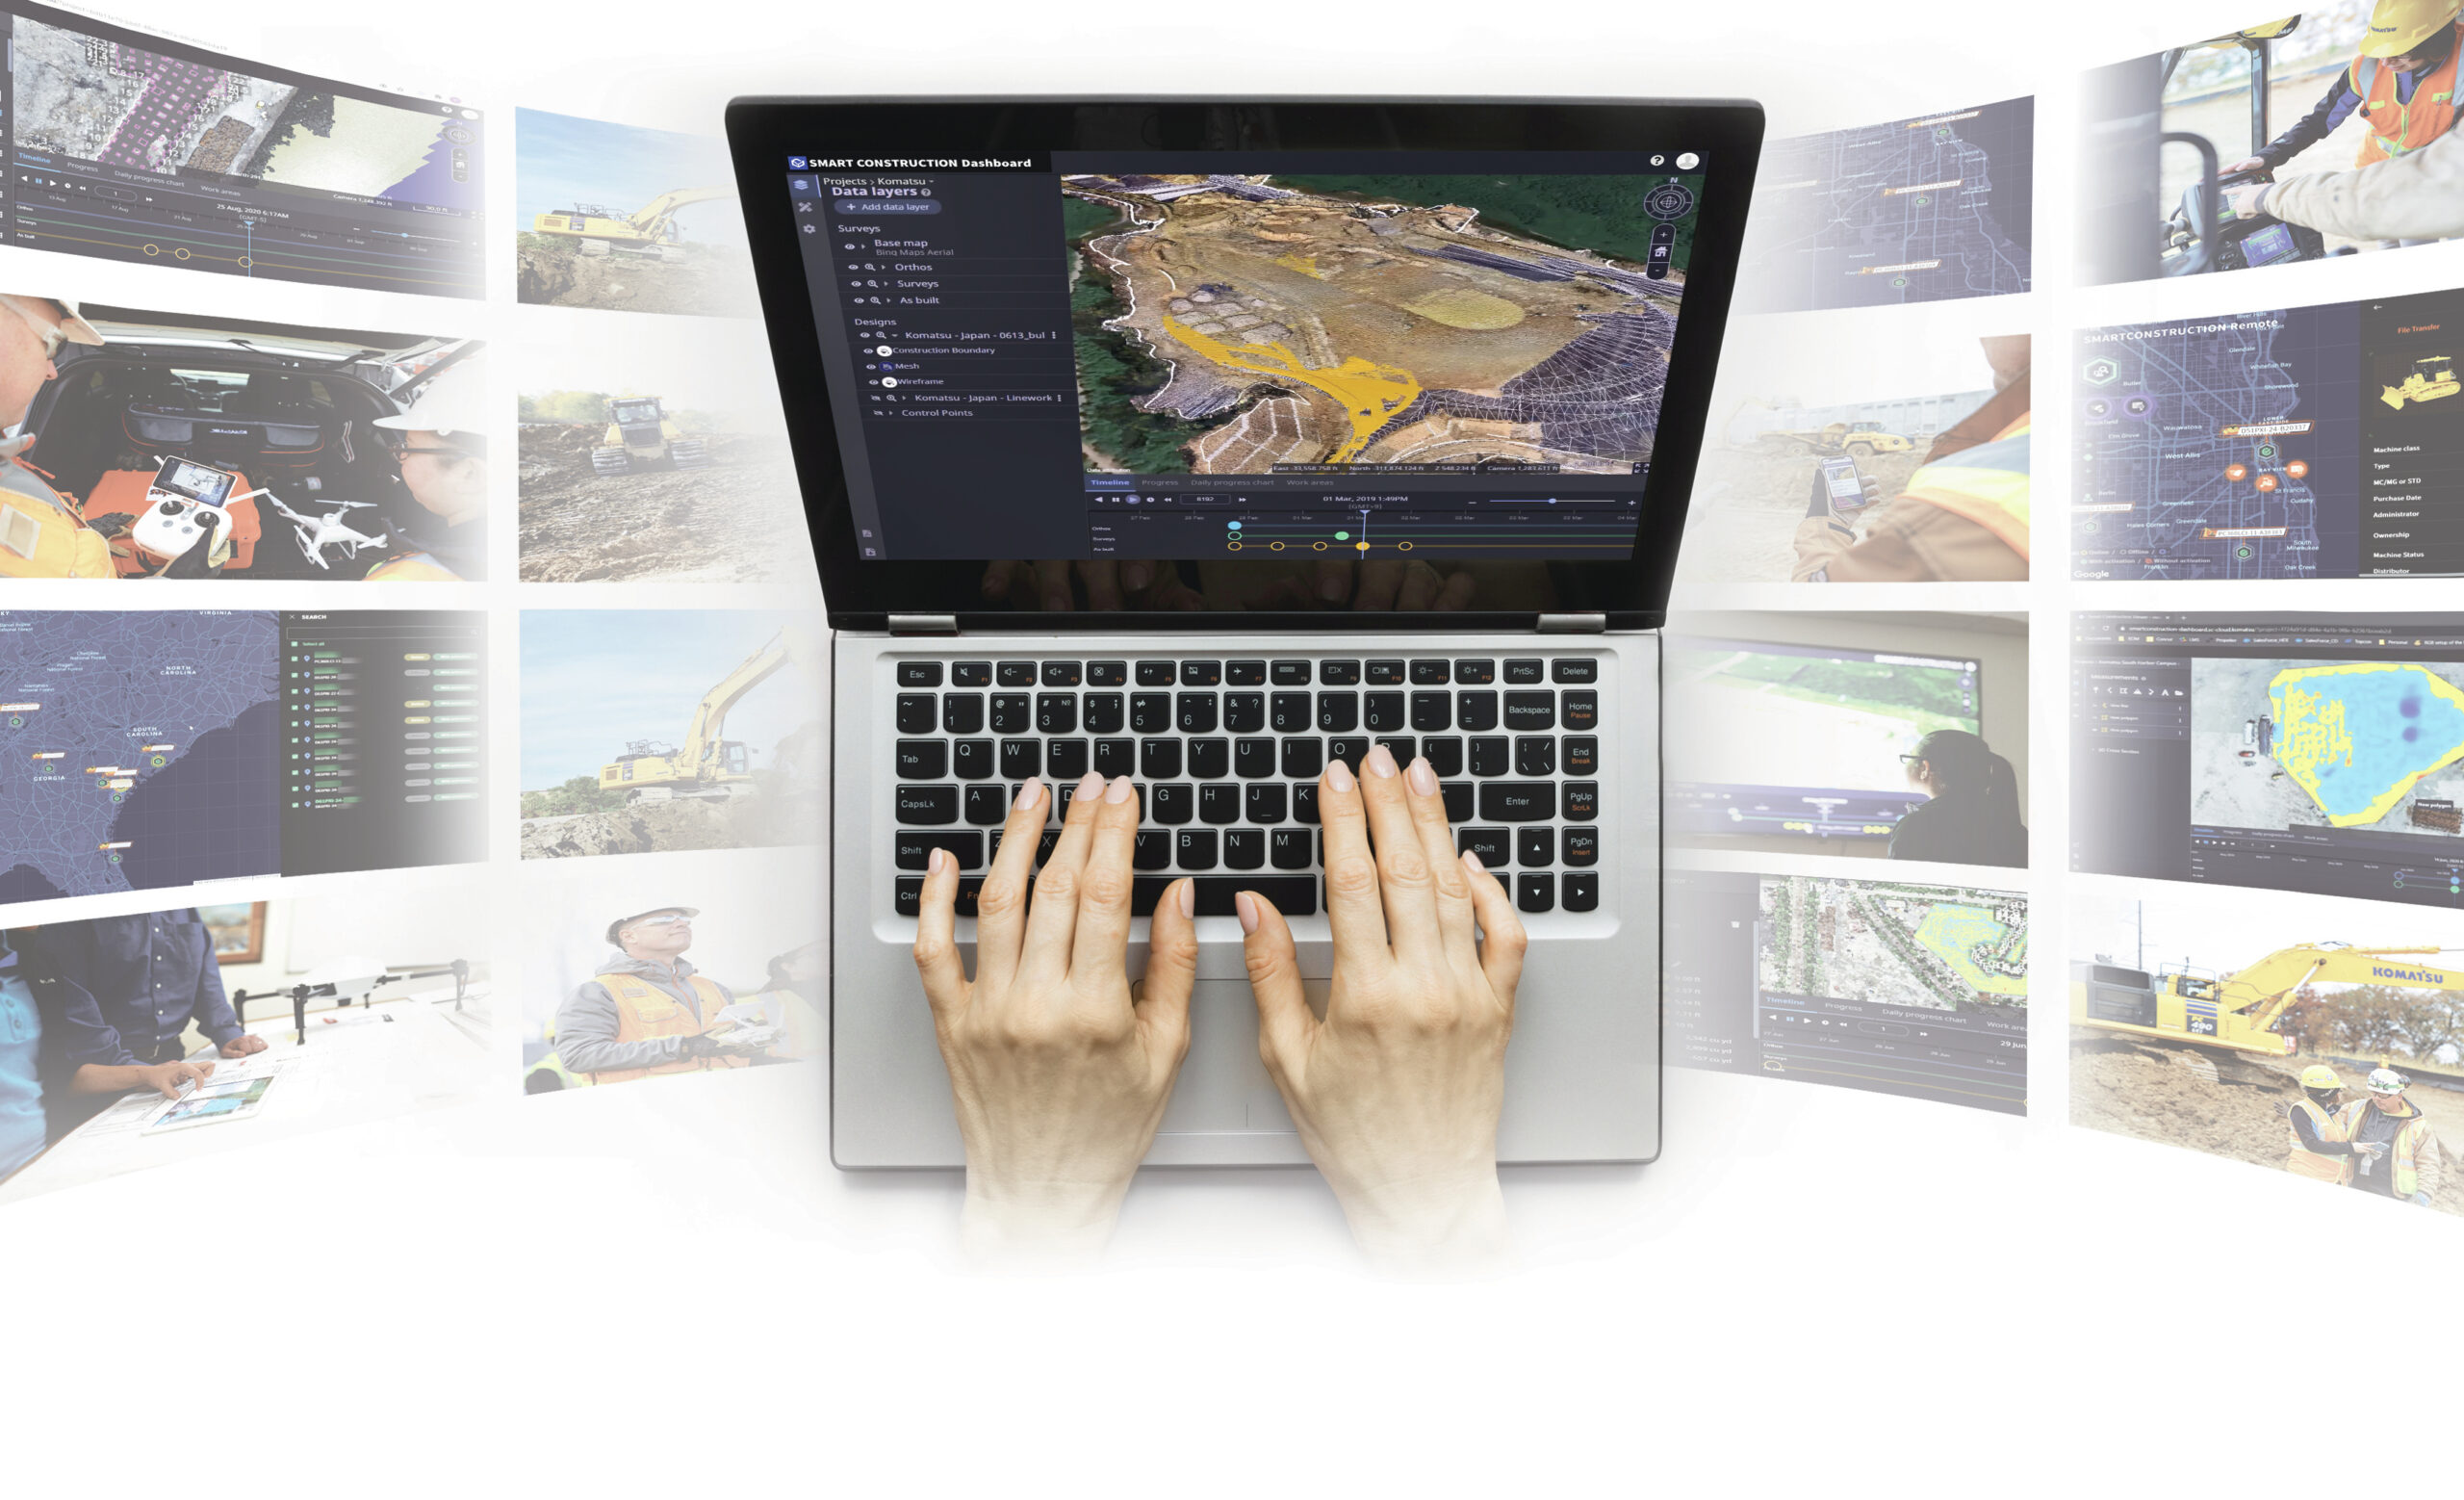
Construction teams can visualize the status of their job sites in one comprehensive snapshot with Komatsu’s Smart Construction Dashboard.

To better manage their businesses, construction operations teams need a go-to solution to visualize the status of their jobsites. With Komatsu’s Smart Construction Dashboard, they can.
Built to support the digital transformation of customers’ worksites, Komatsu’s suite of Smart Construction solutions leverages the power of IoT to help customers orchestrate construction planning, with the aim to better handle management and scheduling, streamline costs, and optimize processes remotely—in near real time.

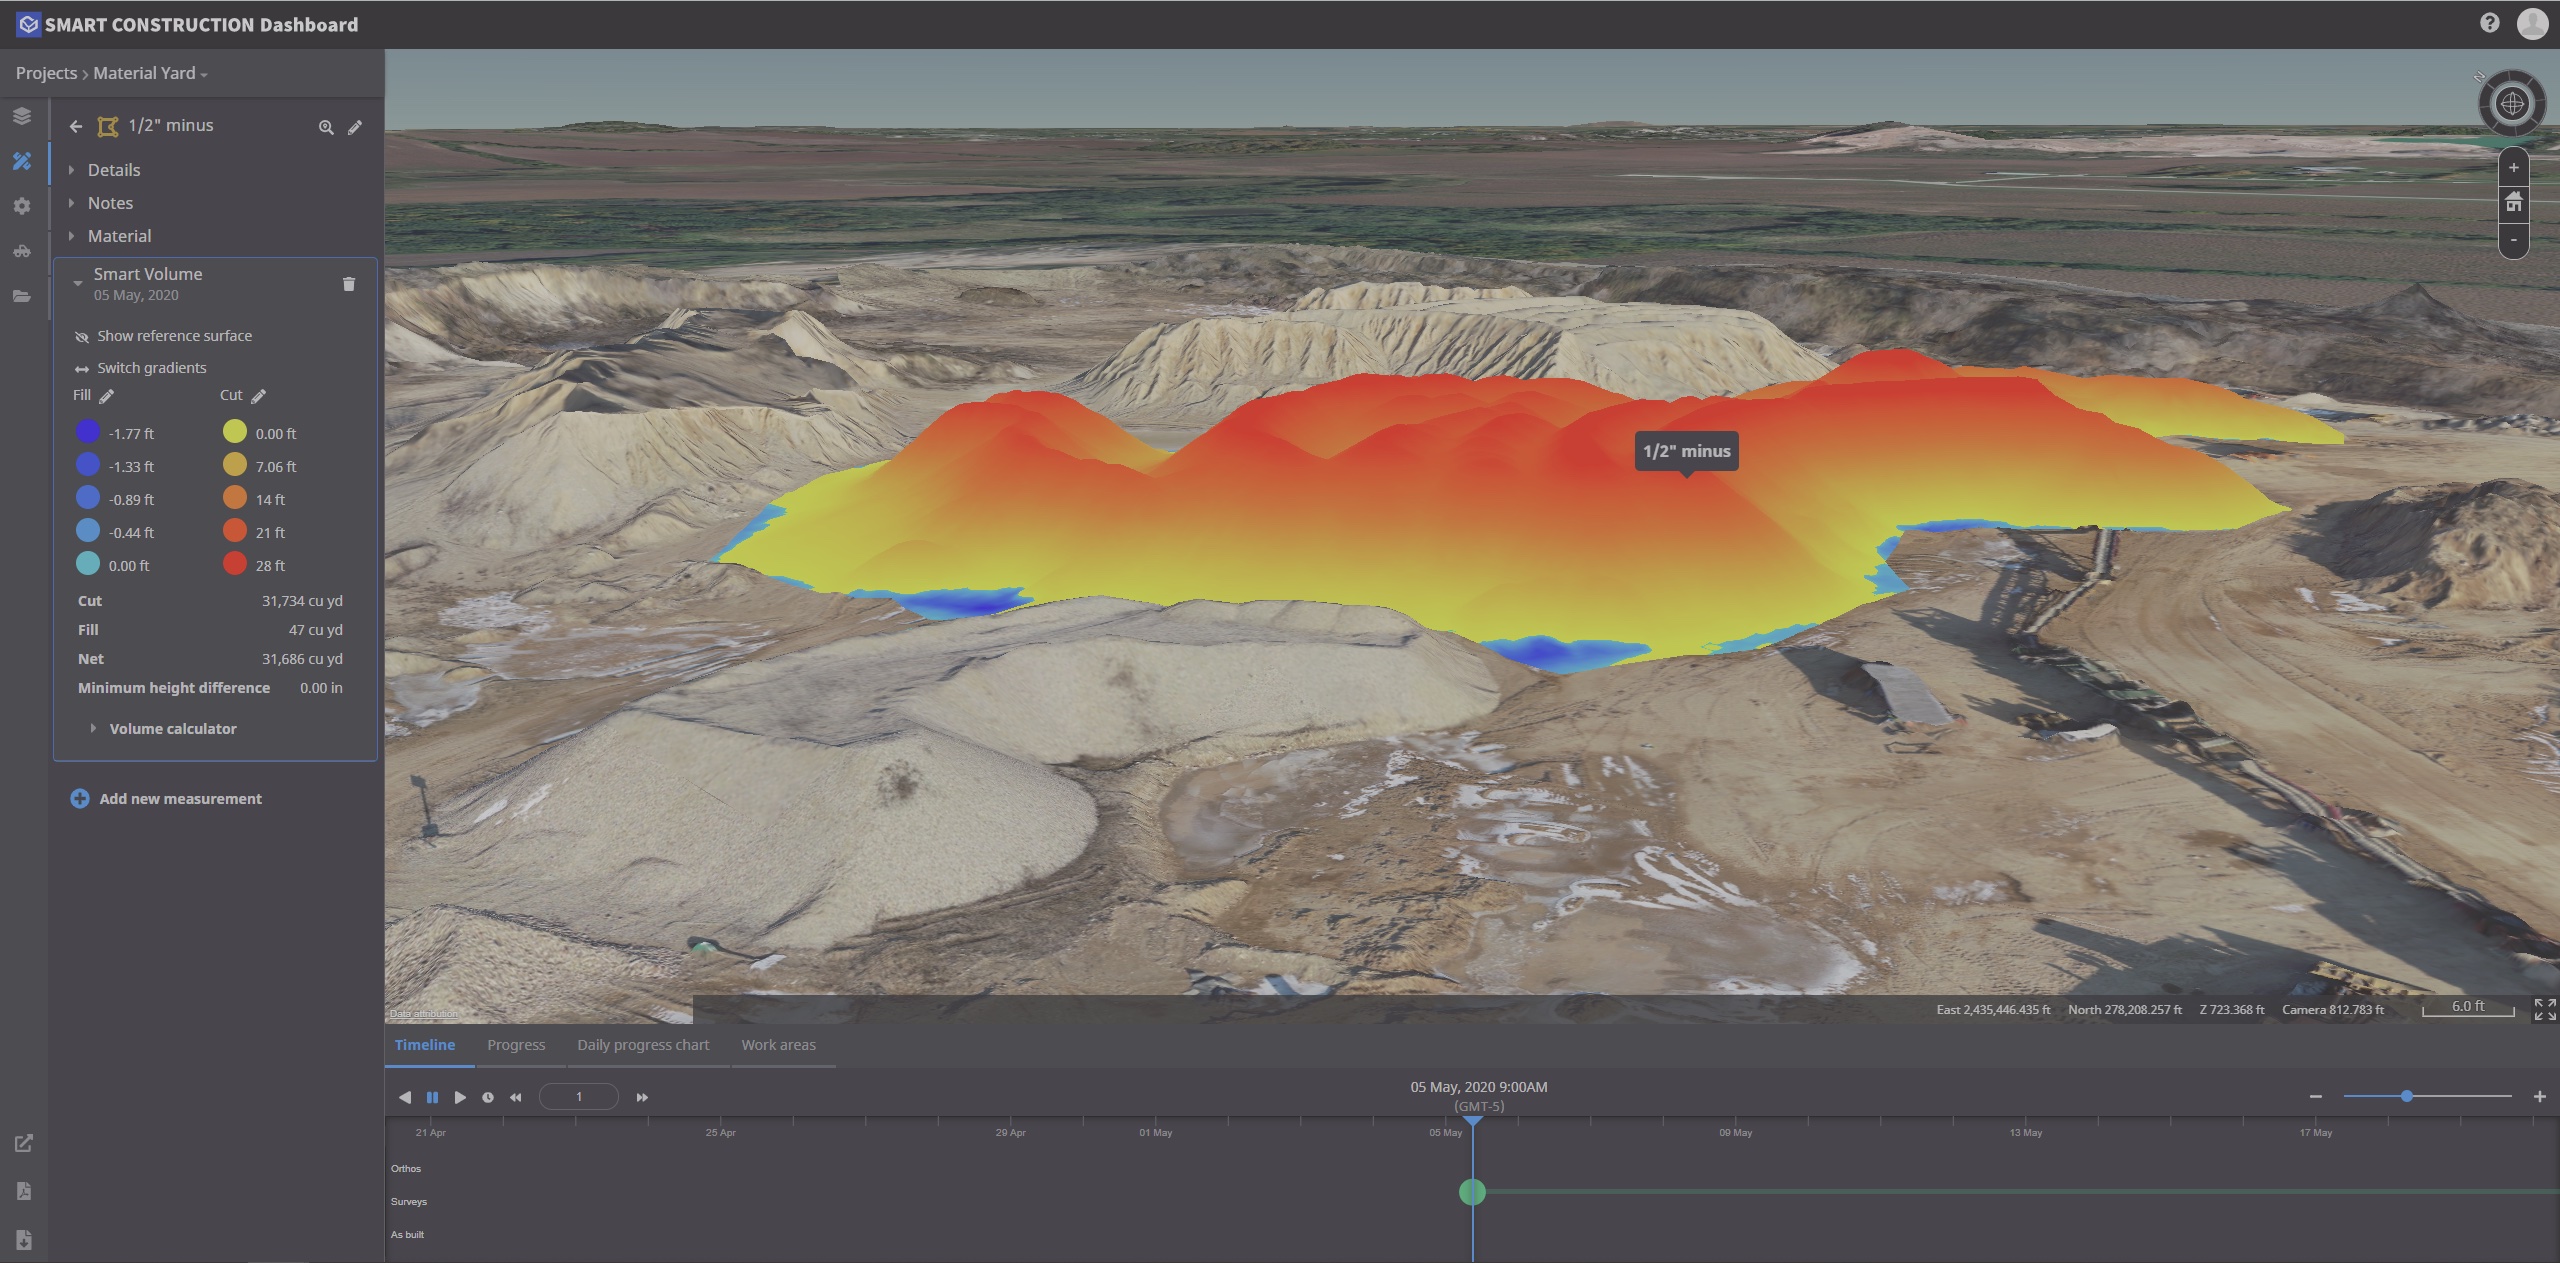
Smart Construction Dashboard is designed to be used daily and combines data from multiple sources into one comprehensive picture. Smart Construction Dashboard provides contractors with 3D graphic visualization of all design, drone and machine data to measure cut/fills, quantities and productivity. Site progress can be viewed with timeline functions (including playback) in terms of whole-site visuals, cross-sections and individual measurements.
Smart Construction Dashboard at-a-glance
- Confirm pre-bid topographical map is correct,
- Track project job site progress in near real time;
- Document site conditions as evidence for change orders;
- Quickly and easily measure stockpile quantities.
“What is really cool is that the flight surface data from our drone is loaded to the Smart Construction Dashboard and we can very quickly see changes—the actual progress”,
said Andie Rodenkirch, project manager for Hunzinger Construction Company. “Technologies that let operators do the job one time and do it correctly increase efficiency, so it’s been a great tool for us.”

Smart Construction Dashboard is part of Komatsu’s new Smart Construction Solutions, an umbrella of smart applications created to help construction customers optimize their business remotely, and in near real time. Smart Construction Dashboard is powered by the 3D visualization power and geospatial accuracy of Cesium, a leading platform to visualize, analyze and share 3D data. Cesium’s 3D visualization engine combines video game computer graphics technology with accuracy that ties data to its precise location on the globe.
 Copyright 2020 All rights reserved.